On Sheet – String Theory
On Sheet – String Theory
 e’ve talked all about simulating how trains run, how timetables are read and how TT&TO, Warrants, all those things work. But there you are in your layout room, looking at your yards and staging tracks, your passing sidings and goods yards, and you find yourself thinking, “So just how do I figure out a timetable in the first place?”
The answer, my friend, are String Diagrams.
From a posting or two blogs ago, an online friend noted that he uses a string diagram to run his railroad. I’ve even mentioned that I use something very much like a string diagram to run a CTC board. But really, what the heck am I talking about? Why are String Diagrams a very useful technique to develop your operations?
As a picture is worth a thousand words, here is a basic layout string diagram…
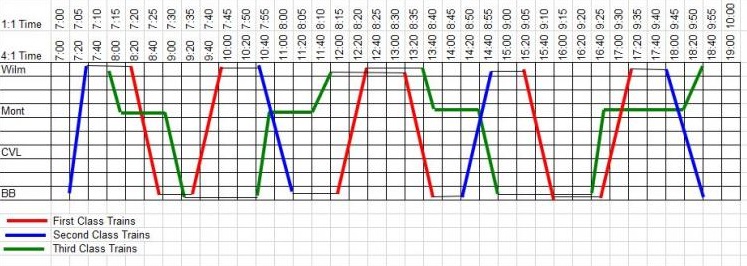
So how does this work? First, you want to make a graph. The vertical axis will be a list of all locations on your layout (in order of appearance) The horizontal axis is time. This allows you to see (graphically) where a train is at every moment of your session.
First, you’ll want to run a train across your railroad at normal speeds. If you are using a fast clock, record off that. Otherwise, use a real clock. This gives you an idea how “steep” the lines will actually be.
Now draw your first line in (use a pencil with a big eraser). If you have a very important train, the one your layout is centered around (for me, it would be the Noon Daylight) draw that. Start from the origin and drawing a line that goes to the next station (in the time you recorded it took) draw its line, working it all the way to the destination.
Then work your next train in. Notice that they’ll slope up for one direction, down for opposing directions. That’s normal. HOWEVER, make sure that wherever lines cross, there is some sort of passing siding. If lines cross where there is no passing siding, that’s where you’ll want to send your ambulances and coroner to.
Note that station stops and other loiterings are represented by horizontal lines.
As you add more trains, you’ll have to work a bit to make sure every train passes where it can. You might realize (using this method) that you simply cannot get trains past each other. But that’s okay. At least you know.
Once you have this, you actually have a working timetable for your railroad. If you wish, you can easily draw up a real world timetable to run off of, using the times and locations you’ve charted. Make sure you clearly indicated meets with other trains. Or you can just operate off the graph, keeping track of trains and their predicted progress across the line. If a train cannot make its meet, maybe you’ll have to hold the first train there until they can successfully meet. Or maybe (if you look down the graph) there is an alternative meet location – do your dispatcher stuff to efficiently make this change (just for today) and make things efficient. You can even use these graphs to look for holes to get extra trains (ones not ordinarily run) across your division.
That’s it in a nutshell – string diagrams are a very efficient tool one can use to chart railroad operations and keep the wreckage out of the cornfields!